Most dashboards start with a developer, a brief and a few weeks of waiting. They don’t have to any more. I wanted to see how far that’s changed, so I built one from scratch with Claude Cowork: no code, no software to buy, just describing what I wanted in plain English.
To make it fun, I built it around something I actually care about. I’ve followed Formula 1 for as long as I can remember (the daft early starts for the flyaway races, the strategy arguments, the lot), so I pointed Cowork at free, open F1 data for the 2026 season. It’s public, so anyone can use it, which means I can share every step with you. (Your own business data, naturally, would stay private; more on that later.)
The whole thing took about an hour, spread over a couple of days so I could come back and watch it quietly update itself as the season moved on. That turned out to be one of the most useful parts; more on it shortly.
New to this? Two quick definitions
What is Claude Cowork?
Claude is an AI assistant, and it comes as a desktop app for Mac and Windows. Inside the app there are three ways to work with it:
- Chat – the everyday one: ask a question, get an answer, have a conversation.
- Cowork – you hand it a task and it works alongside you to get it done: searching the web, pulling in data, and building things like this dashboard. It can create “live artefacts”, interactive pages that keep themselves up to date.
- Code – the version built for software developers, working directly inside their projects.
For this, I used Cowork. I never wrote or saw a single line of code; I just described what I wanted, in normal sentences. And if you’re on a Team or Enterprise plan, you can share the dashboards you build with colleagues, which is where it gets genuinely useful for a business.
What is an API?
An API is simply how one piece of software asks another for information. Think of ordering in a restaurant: you ask the waiter for a dish, they fetch it from the kitchen and bring it back, and you never need to know how the kitchen works. The Formula 1 data here comes from a free, public API; my dashboard asks “who’s leading the championship?” and gets a tidy answer back. Your own business software (accounting, your customer list, and the rest) almost always has APIs too. That’s how a dashboard can pull in your real numbers.
How I built the dashboard in Claude Cowork, step by step
The whole thing was a conversation. There was no setup, no template and no menu of options to wade through; each step below is a single instruction I typed in plain English, followed by what appeared on screen. I’ve kept my exact wording so you can see there’s no trick to it.
1Describe what you want
It began with one instruction:
What I typed
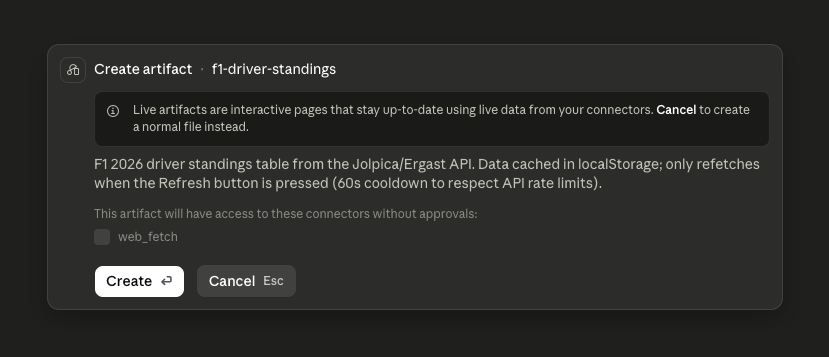
I’d like a personalised Formula 1 dashboard as a live artefact. Use this free data source for current driver standings: https://api.jolpi.ca/ergast/f1/current/driverstandings.json – start by showing me the standings as a table. Note, this is a free API with rate limits, the dashboard should fetch once and store the data, not hammer the API, and have a refresh button.
Before it built anything, Cowork showed me its plan. It would store the data in the browser and only fetch fresh figures when I pressed Refresh, with a 60-second cooldown, in its own words, “to respect API rate limits”. I’d mentioned the limits, but it was Cowork that worked out the sensible mechanism and built around it.
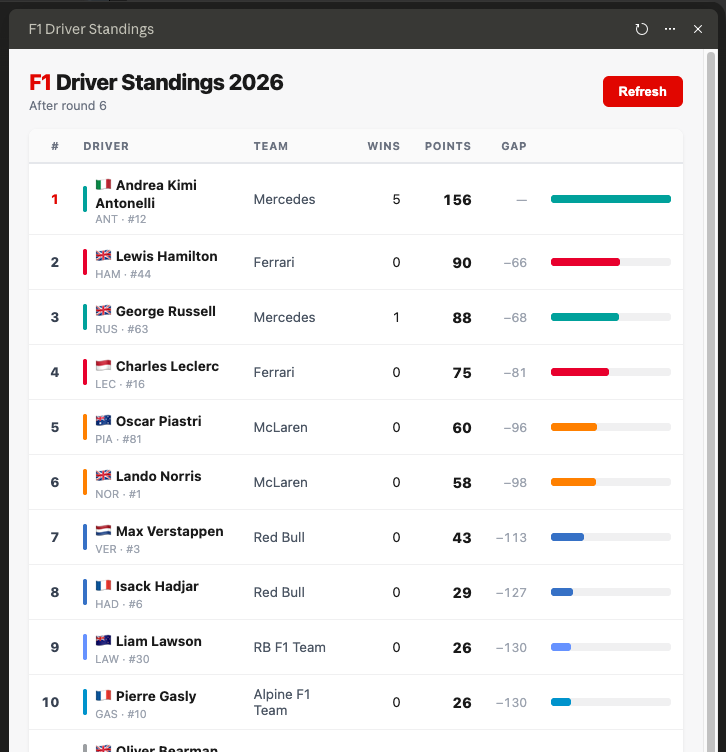
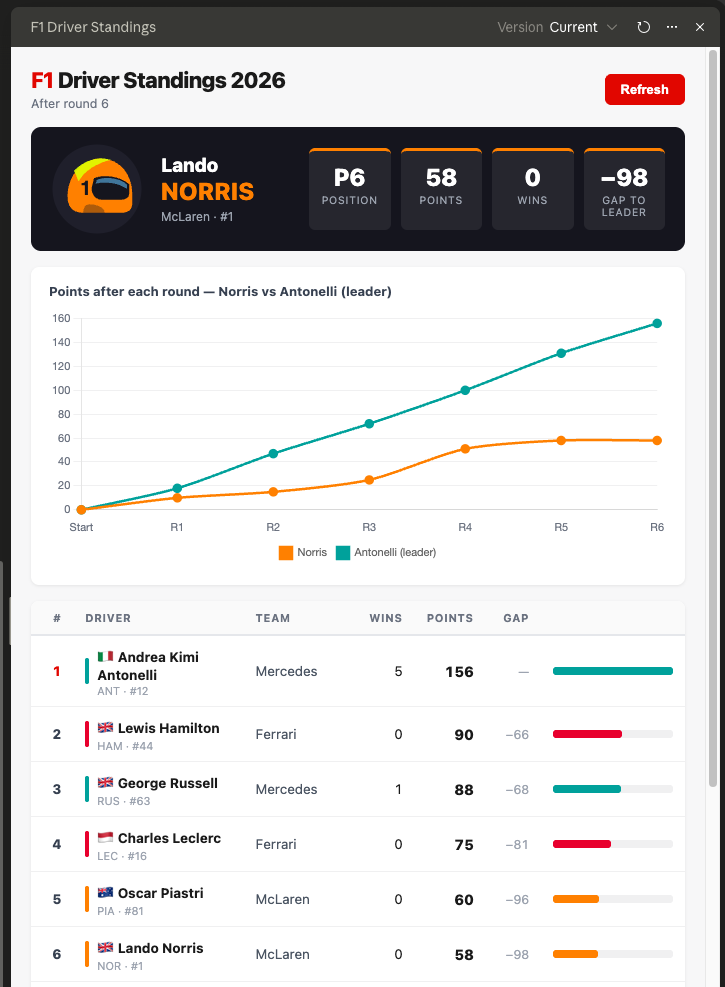
A few seconds later, there it was: a clean, readable standings table, current to the latest round, with team colours and the gap to the leader already worked out. I’ll admit I grinned.
For your business
The same instinct matters with your systems. A good dashboard reads from your accounting software, your customer list or your spreadsheets gently and on a sensible schedule; it doesn’t pester them every time someone opens a page. It’s reassuring that it thinks about that on your behalf.
2Make it yours
Next, I made it personal, and showed my colours:
What I typed
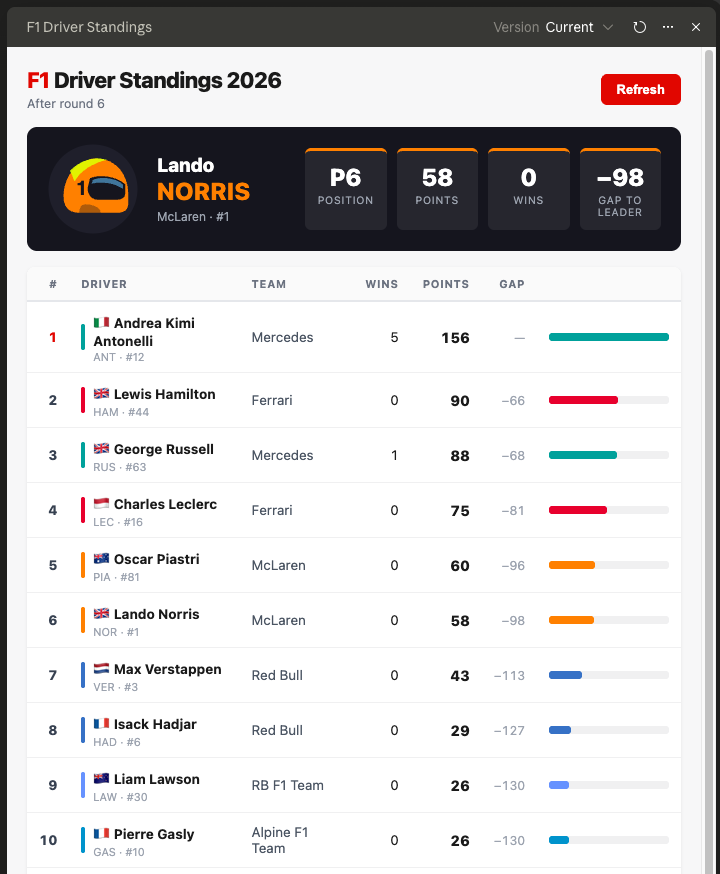
I’m a Lando Norris fan. Add headline cards at the top: his championship position, points, wins, and the gap to the leader. Include an image.
Four headline cards appeared: position, points, wins and the gap to the leader. I’d only asked for “an image”, and it added his racing helmet in his team colours, a nice touch I hadn’t specified. One sentence turned a neutral table into my dashboard.
For your business
Swap “Lando Norris” for a salesperson, a branch or a product line, and those headline cards become the four numbers that person checks first thing in the morning: revenue, pipeline, target, and the gap between where they are and where they need to be.
3Show the story over time
A table tells you where things stand. I wanted to see how they got there:
What I typed
Add a line chart of his points after each round compared to the championship leader. Standings after any round are at https://api.jolpi.ca/ergast/f1/2026/{round}/driverstandings.json – fetch each round once, don’t re-request.
Two lines, round by round: my driver against the championship leader. The gap you can feel in a table becomes a gap you can actually see opening up.
For your business
This is the chart most owners actually want: performance against target, month by month. Are we closing the gap or losing ground? It’s a far more useful question than a single number sitting on its own.
4Look forward and back
Then the two questions any fan asks on a race weekend: what’s next, and how did we just do:
What I typed
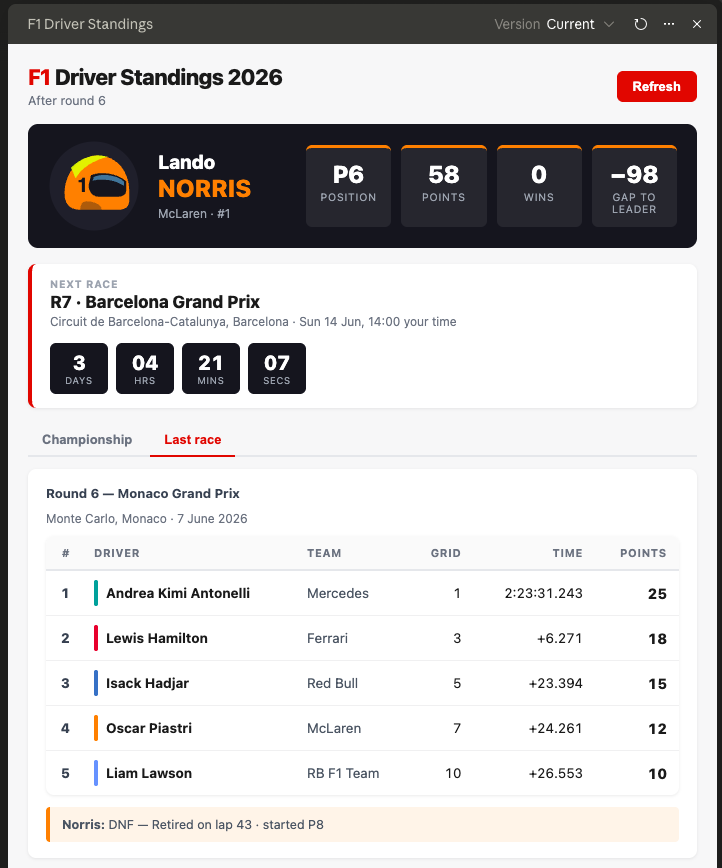
Using the API, add a countdown to the next race using the calendar, plus the last race’s top five in a new tab.
A live countdown to the next Grand Prix appeared under the headline cards, alongside a new “Last race” tab showing the podium and the top five. Forward and backward, on one screen.
For your business
A countdown to your next deadline, renewal or delivery date; last month’s results one click away. The same two questions every team asks: what’s coming, and how did we just do.
5The honest bit: when it got something wrong
This is the part I nearly left out, then realised it was the most useful thing in the whole exercise.
The “Last race” tab showed the Canadian Grand Prix. Now, I’d watched the season; I knew full well the most recent race was Monaco. Worse, Cowork was confident about it: it explained, in fluent and entirely plausible terms, that the data feed was “lagging” and that Monaco would appear “on a future refresh once the feed catches up”.

It sounded right. It wasn’t. So I pushed back, in the plainest possible terms:
What I typed
Double check the data, it should be up to date.
No technical detail. No mention of why it might be wrong. Cowork rechecked, found its own mistake (it had only pulled part of the results, not all of them) and corrected the page to show Monaco, the genuine last race.
For your business: the one to remember
You don’t need to be technical to keep one of these honest. When something looks off, you say so in plain words, and it investigates and fixes it. And notice the dashboard was never showing nonsense; it was showing an older race, correctly. “Out of date but true” is the quiet failure to watch for in any dashboard, which is exactly why the way it refreshes matters as much as how it looks.
6Personalise it on demand
Finally, the bit that makes “personalised” real for more than just me:
What I typed
Add a dropdown to pick any driver; the whole dashboard should re-centre on whoever I choose.
A dropdown appeared at the top. Pick any driver and the entire page follows: the headline cards, the trend line, the gap to the leader. I switched from Norris to Hamilton and everything re-centred on the new choice.

One small note: by this point the dashboard read “after round 7” rather than “round 6”. That’s the live data at work: because I’d come back to it across a couple of days, the next race had already rolled in on its own. Exactly the behaviour you’d want from something you check each morning.
For your business
This is what “personalised” really means for a team. One dashboard, but every manager picks their own view (their branch, their team, their numbers) without anyone having to build twelve separate versions.
As much as I love it, none of this is really about Formula 1
Every element on the page maps cleanly onto something you already track:
| On the F1 dashboard | The same idea in your business |
|---|---|
| The championship table | A live league table: sales, teams, branches or products |
| Gap to the leader | Gap to target, or variance against budget |
| Points after each round | Revenue or any KPI, trending month by month |
| Countdown to the next race | Your next deadline, renewal or delivery date |
| Last race’s results | Last month’s numbers, a click away |
| Pick-a-driver dropdown | Each manager sees their own view, from one dashboard |
Fancy trying it yourself?
Here are the exact prompts I used, in order. You’ll need Claude Cowork. The Formula 1 data is free and needs no sign-up; it comes from the Jolpica API (the open successor to Ergast).
- Ask for the dashboard and point it at the data: “I’d like a personalised Formula 1 dashboard as a live artefact. Use this free data source for current driver standings:
https://api.jolpi.ca/ergast/f1/current/driverstandings.json– start by showing me the standings as a table. Note, this is a free API with rate limits, the dashboard should fetch once and store the data, not hammer the API, and have a refresh button.” - Make it personal: “I’m a [your driver] fan. Add headline cards at the top: his championship position, points, wins, and the gap to the leader. Include an image.”
- Show the season’s story: “Add a line chart of his points after each round compared to the championship leader. Standings after any round are at
https://api.jolpi.ca/ergast/f1/2026/{round}/driverstandings.json– fetch each round once, don’t re-request.” - Add what’s coming and what just happened: “Using the API, add a countdown to the next race using the calendar, plus the last race’s top five in a new tab.”
- Make it personalised on demand: “Add a dropdown to pick any driver; the whole dashboard should re-centre on whoever I choose.”
And if anything ever looks out of date, do what I did: tell it to “double check the data, it should be up to date” and let it sort itself out.
A quick, honest word on using your own data
There’s one real difference between my F1 dashboard and one for your business, and I’d rather be straight about it. Formula 1 data sits in a free, open feed that anyone can use. Your numbers don’t; they live in your accounting software, your customer list, your spreadsheets and the systems your team uses every day.
Connecting to those takes a little more thought, because it has to be done securely and with the right permissions. The good news is: not much more. The data is already there, those systems are built to share it safely, and joining it up neatly is exactly the sort of thing we do. The dashboard itself? Still built the same way: by describing what you want.
Final thought
None of this needed a developer, just a clear idea and plain English. The same approach works for the numbers that actually run your business: sales, jobs, cash flow, project status, whatever you check most.
If you’d like a live, personalised dashboard built around your real data, we’ll help you do it properly: the secure connections to your systems and the parts that need care. We’re a Sussex-based team and happy to talk it through. 👉 Get in touch.